
Using the AI Visibility Dashboard
Monitor your brand in AI-generated answers using the AI Visibility Dashboard to track detection rates, mentions, citations, and sentiment metrics
How to use the dashboard effectively
In this article you'll find these steps 👇
- Step: Start with the Detection Rate
- Step: Compare Mentions and Citations
- Step: Check the Sentiment Score
- Step: Use competitor comparisons as a guide
The AI Visibility Dashboard is a directional indicator and not an absolute benchmarking tool. Use the data to recognize developments, identify opportunities, and derive priorities for optimization measures.
Individual daily values can fluctuate. Meaningful trends only emerge over a longer period.
Observe developments instead of snapshots
The biggest insights come from analyzing data over several weeks. Use the time series visualizations in the Brand Performance Over Time section in particular to spot changes and trends early on.
We recommend observing data over at least two to three weeks before deriving strategic decisions from it.
Metrics Breakdown
The Metrics Breakdown gives you a compact overview of your most important AI Visibility metrics. It helps you better assess your brand's visibility in AI-generated answers and identify optimization potential in a targeted way.
Learn more about individual metrics and the dashboard structure:
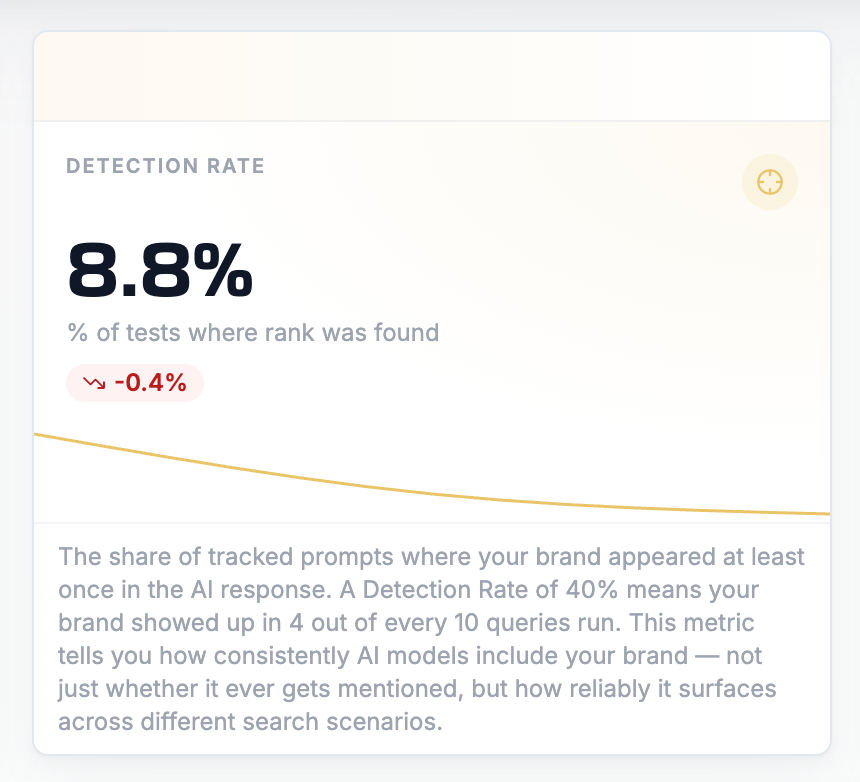
1. Start with the Detection Rate
The Detection Rate answers the fundamental question:
Is your brand even being noticed?
If your Detection Rate is low (under 20%), your content and brand appear only rarely in relevant AI answers. In this case, your focus should initially be on expanding your presence and authority.
2. Compare Mentions and Citations
Mentions show your brand's pure presence.
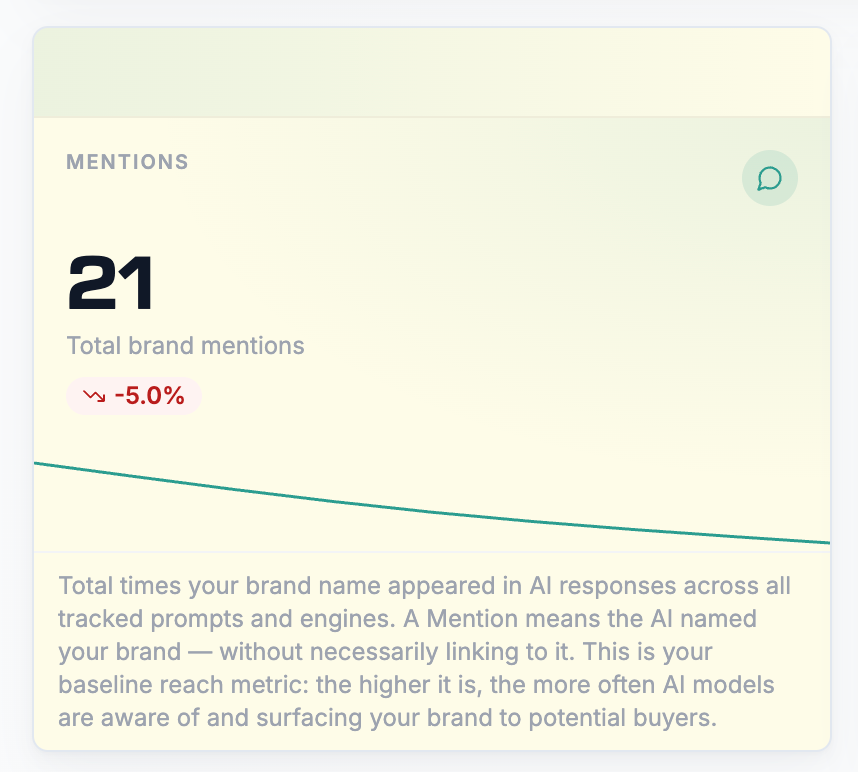
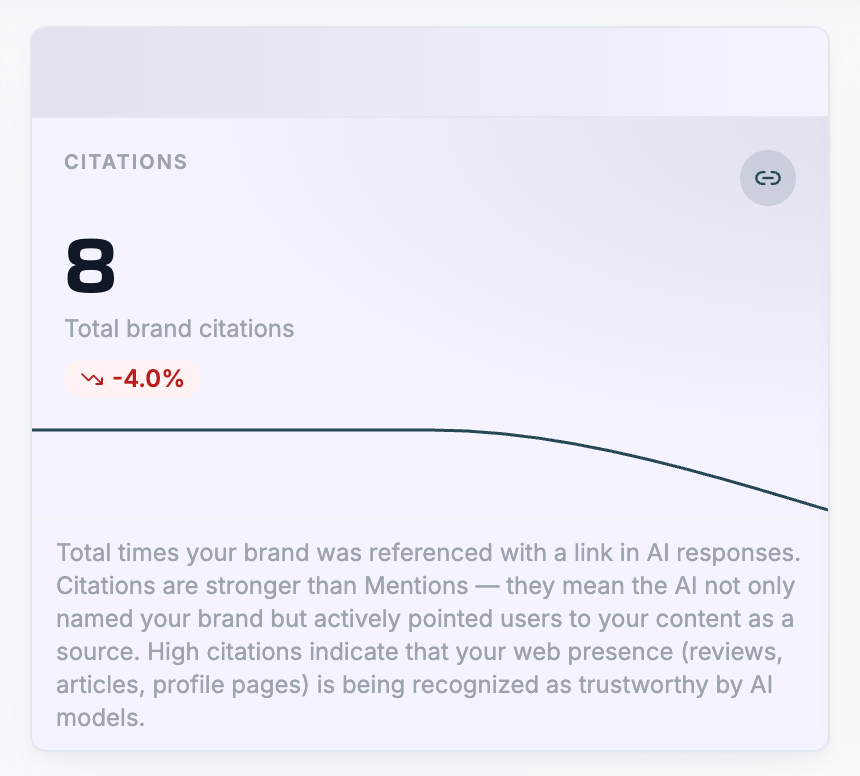
Citations show whether AI systems actively use your content as a source.
A common situation:
- High Mentions
- Low Citations
This often means your brand is well-known, but your content isn't yet perceived as a trustworthy reference.
This is often where the biggest optimization potential lies.
3. Check the Sentiment Score
Visibility alone isn't enough.
What also matters is how your brand is presented.
A positive Sentiment Score indicates that your brand is associated with relevant benefits, positive reviews, or strong market positions.
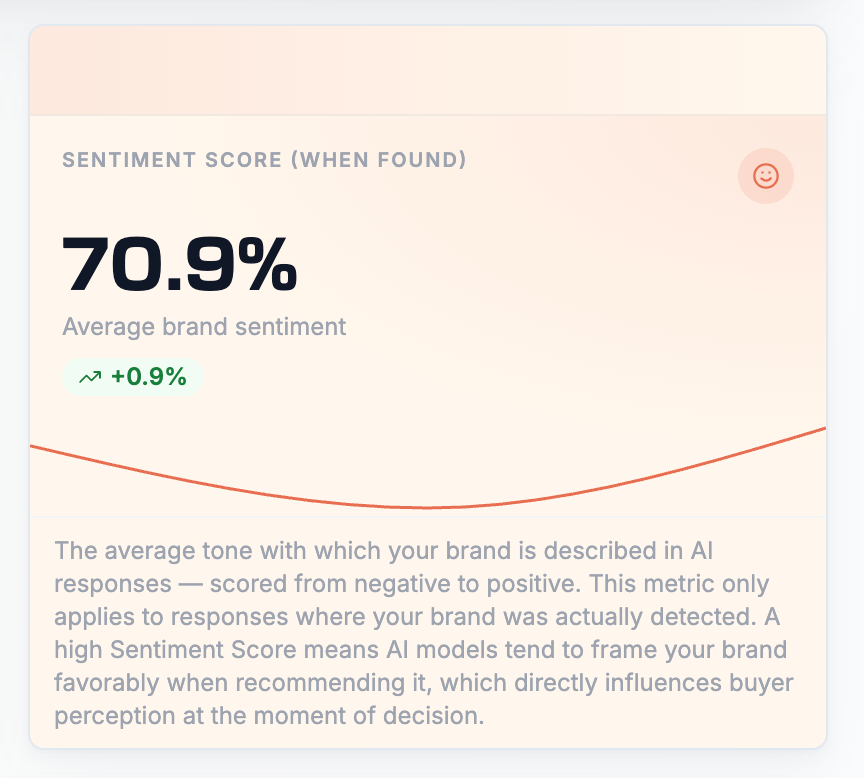
Neutral or negative representations, on the other hand, can influence potential buyers' perception, even if your visibility is already high.
4. Use competitor comparisons as a guide
The sections Mentions by Competitors
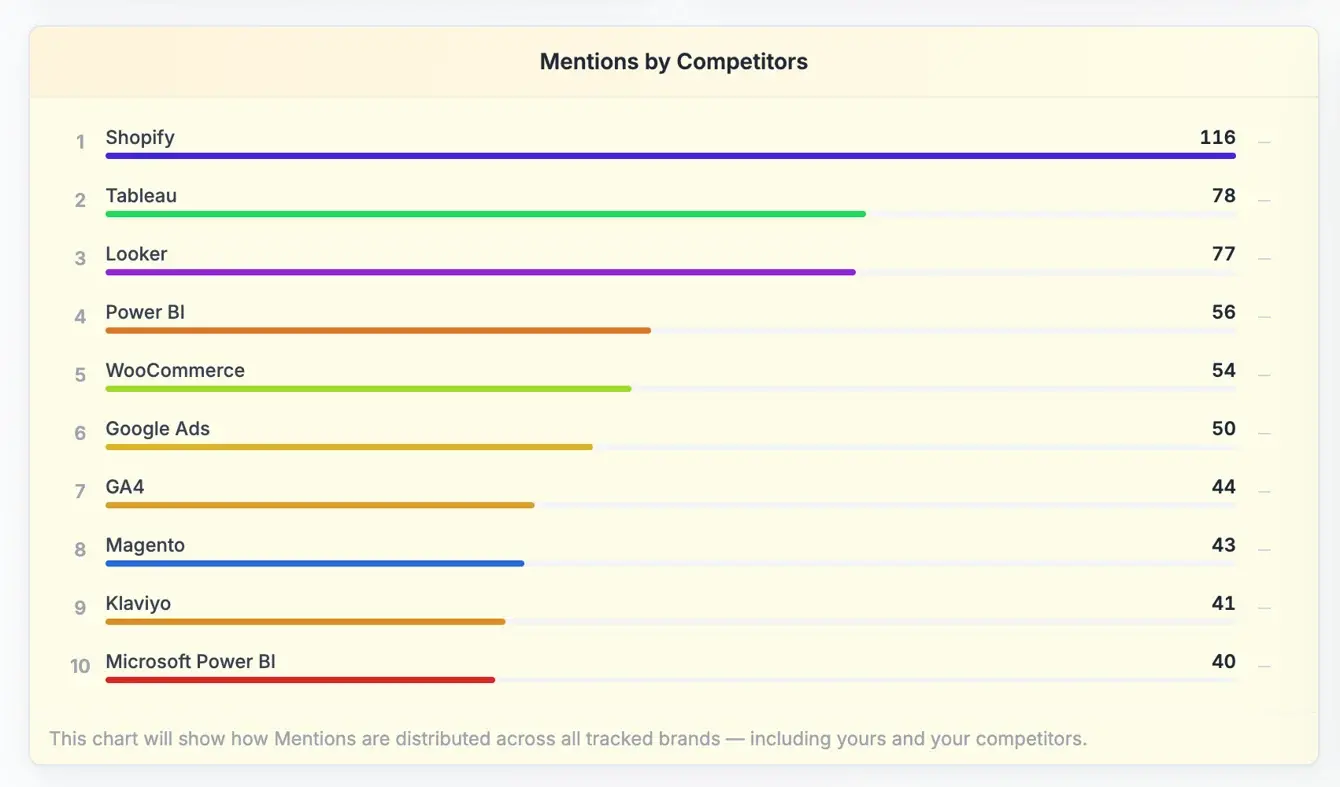
and Citations by Competitors help you better assess your position in the market.
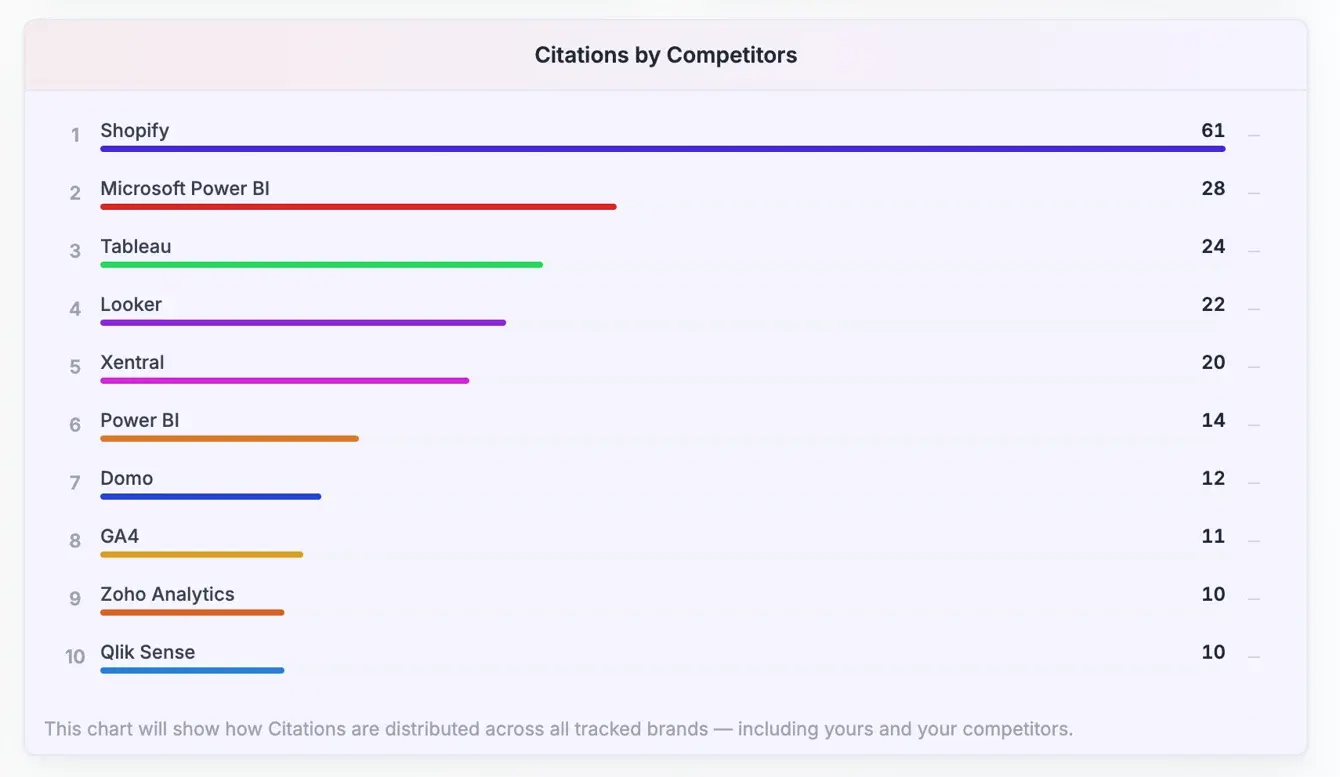
If competitors consistently outperform you in mentions or source references, this is often a sign of stronger content presence, higher authority, or better discoverability of their content.
Use these insights to identify optimization potential for your own AI Visibility in a targeted way.
Important note
The background colors of the KPI cards are solely for orientation:
- Green stands for presence and reach (e.g., Mentions, Citations).
- Yellow-Orange signals consistency (e.g., Detection Rate).
- Red tones stand for qualitative signals (e.g., Sentiment Score).
The colors should not be understood as a direct assessment of "good" or "bad," but rather support you in quickly categorizing the different metric categories.
 Powered by happysupport.ai